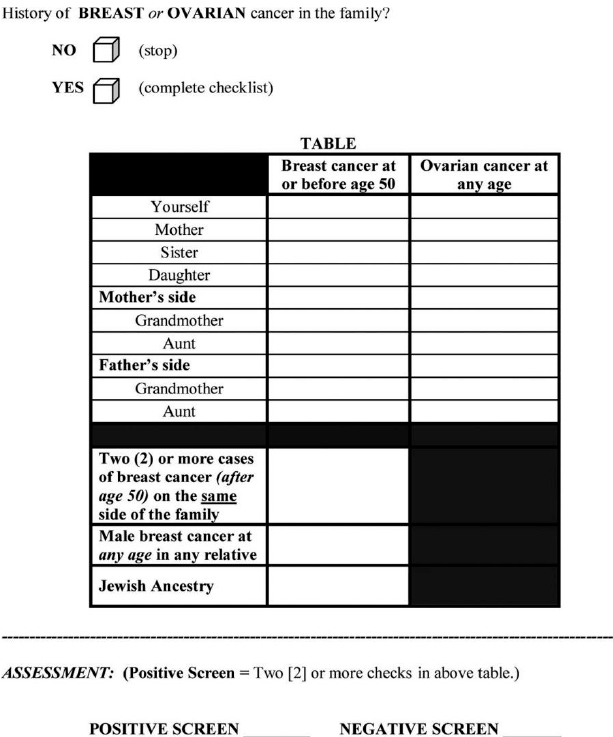
Mutations in BRCA1 and BRCA2 (BRCA1/2) genes increase the risk of breast and ovarian cancer, but the genetic test for them is costly. There are models to assess the probability of carrying a BRCA1/2 mutation, but they are complicated and time-consuming, requiring a very detailed family history (“pedigree”). Bellcross et al.[1] evaluated the accuracy of a referral screening tool (RST) designed for use in primary care practice to help clinicians select patients for BRCA testing (Figure).

From the abstract (reprinted with permission; see above): Methods: The RST was administered to 2464 unselected women undergoing screening mammography. Detailed four-generation cancer pedigrees were collected by telephone interview on a random subset of 296 women. The pedigrees were analyzed using four established hereditary risk models…with a ≥10% BRCA1/2 mutation probability using any [established] model as the definition of “high risk.”
Results: The RST identified 6.2% of subjects as screen “positive” (high risk). … In comparison with the pedigree analyses [i.e., the four established hereditary risk models], the RST demonstrated an overall sensitivity of 81.2%, specificity of 91.9%, [PPV of 80%, NPV of 92%], and discriminatory accuracy of 0.87.
For the pedigree analysis of 296 women, the authors chose to oversample (randomly) from the RST-positive group, 1 which only represented 6.2% of the screening mammography population, “to provide a sufficient number of potentially high-risk pedigrees to adequately address sensitivity.”
a) Is the sampling of the 296 women in this study cross-sectional, case-control, or test result-based (index positive-negative)?
The following table shows results in the pedigree analysis sample consistent with what the authors reported:

Now you want to know the sensitivity and specificity of RST in the underlying mammography population (n= 2464).
b) Given that 6.2% of the subjects in the entire mammography population were
identified as RST positive and the predictive values observed, complete the following 2 × 2 table and calculate the sensitivity and specificity of RST in the entire mammography population.
[Hint: First figure out how many in the entire population tested positive, to fill in the cell labeled “A”.]

c) Compare the sensitivity and specificity of the RST in the mammography population you obtained from (b) with what was reported in the abstract. Why are they different? Which do you think is correct?
In the Results section the authors wrote:
“It should be noted that these predictive values are not representative of those that would be obtained in a general mammography population, as … high-risk subjects were intentionally oversampled. Using the prevalence of 6.2%
RST screen-positive individuals in this study, and the overall sensitivity and specificity obtained, the PPV and NPV values expected in a general mammography population would be 0.39 and 0.78, respectively.”
d) Do you agree with the authors that the PPV and NPV, not the sensitivity and specificity, are the measures that needed to be adjusted to be representative of the ones in the mammography population? Explain.
Back to all Chapter 2 Problems
Back to all Chapters
References
Bellcross CA, Lemke AA, Pape LS, Tess AL, Meisner LT. Evaluation of a breast/ovarian cancer genetics referral screening tool in a mammography population. Genet Med. 2009;11(11):783-9.